
Measurable Improvement
In Weeks, Not Quarters.
We don't lead with software — we lead with your processes. Lean Six Sigma establishes a measured baseline and redesigns how work actually flows, so the improvement is tangible and verified before any system is configured. and are simply the means we use to lock those gains in — one proven delivery route, not the point of the engagement. Advanced analytics and AI run through all of it — forecasting demand, predicting exceptions and turning that measured baseline into a live control loop.
D365 FinOps & Business Central ... AI, Copilot & Analytics-Guided
AI +
Analytics Embedded In Every Layer
100%
Fit-for-Purpose Assurance
LSS-Led
Pre-Implementation Analysis
FinOps+
End-to-End Financial Operations
JIT
Advanced Inventory Analytics
Why Do We Redesign the Process Before We Configure Dynamics 365?
Most implementations fail because the system is configured around a vendor template rather than the living dynamics of the business. Ours runs in a fixed order: understand the operation, redesign the process on measured evidence, then configure around what the process now requires.
The last move matters as much as the order. Most of the market stops at a process document: mapped, reviewed, signed off, filed — and never read again. We design processes that enforce themselves, so the workflow performs the step and records the data rather than trusting anyone to remember it. .
ERP configured around the vendor template, not your actual business dynamics
Go-live reveals broken processes now locked in expensive software
Financial operations remain fragmented — no end-to-end FinOps integrity
Inventory decisions made on gut feel, not data — excess stock, space and cost
No baseline measurement — no way to prove ROI or track improvement
Analytics stop at static reporting — no forecasting, no anomaly detection
Deep immersion in your business moving parts before any module is configured
LSS value stream analysis guarantees fit-for-purpose design, not templates
Full FinOps coverage: invoicing, AP/AR, 3-way matching, assets
Analytics-driven JIT inventory — smaller footprint, lower warehousing cost
Every improvement statistically verified against a pre-implementation baseline
AI embedded in process design — forecasting, detection, automated exceptions

Six Phases: Iterative, Evidence-Based Run with Agility.
AI and advanced analytics are embedded from the first measurement — our own analysis, then Copilot and AI Builder inside the platform — so prediction is part of the process, not a report at the end.
Business Context Immersion
Stakeholders interviewed, processes shadowed, constraints documented — before any ERP conversation.
Define — Value Stream Mapping
Every value stream mapped end-to-end, value-added and not, stress-tested against your objectives.
Measure — Baseline & Capability
A quantified baseline: cycle time, defect rate, throughput, Cp and Cpk on every key workflow.
Analyse — Root Cause & Design
The constraint root-caused and the future state designed before configuration is written.
Improve — ERP Configuration
Configured around the redesigned process, never a template — the workflow enforces the step and captures the data as work happens.
Control — Sustain Excellence
SPC, predictive alerts and control plans embedded in the live environment after go-live.
Four Layers - One Baseline Ledger
Each phase leaves its output in one of four connected layers, and no layer may contradict the measured baseline of the one before it. The platform decision is made inside layer two, on evidence.
Process
Value Stream & Data Flow
Which value streams exist, what each owns, and how work flows — variation designed out.
Information
Business Context-Based Data Model
The data model the process genuinely needs — and the only place a platform decision is made.
Control
Your Steering Mechanism
Control points, limits, predictive alerts and a defined response for every critical process.
Operating
Roles, Cadence, Change
The roles, cadence and change control that hold the gains after the engagement ends.
One Method.
Two Ways To Start.
Lean Six Sigma and Microsoft platform delivery are not two separate services — they are the same data-driven improvement engine, amplified by AI and advanced analytics. We can run it on your processes alone, or carry it straight through into a new . The platform is optional. The improvement is not.
The Shared Method — Applied On Every Engagement
LSS · DMAIC · Data-Verified
Baseline & Data Capture
Measure the process as it actually runs today.
Map the flow, quantify waste and variation.
Root-cause the constraint, then design the future state.
Standard work, SPC and statistically verified gains.
Track A · Process Engagement
Lean Six Sigma Process Improvement
Engage us purely for operational improvement. We work inside the systems you already own — no licence purchase, no platform migration, and no technology decision needed before the value is proven on your own numbers.
- Lead-time and cycle-time reduction
- Waste, rework and variation eliminated at root cause
- Standard work designed to hold without a document to reread
- Control plans and capability tracking
- Capability built in-house through belt coaching
Typical engagement: 6–16 weeks · Existing systems untouched
Track B · Platform Engagement
Microsoft Platform Implementation
When the redesigned process genuinely needs a new system, we configure Dynamics 365 or Business Central around it — fit-for-purpose by design, because the process was fixed before a single module was switched on.
- FinOps: invoicing, AP/AR, 3-way matching, asset management
- Supply chain and analytics-driven JIT inventory
- AI-assisted forecasting, anomaly detection and exception automation built in
- Modules configured to your operational dynamics, not a template
- Workflows that enforce the process and capture data as the work happens, not documents that describe it
- Every improvement baselined against the pre-implementation state
Typical engagement: 4–9 months · Lean Six Sigma-led throughout
Most clients start with Track A, prove the gain against a measured baseline, and only then decide whether a new platform is the right next step. If your processes are already sound and the constraint is your system, we go straight to Track B.You never have to buy a new platform to work with us — and we never recommend one you don't need.Either way the aim is the same: the highest operational standard at the lowest implementation cost, with the return arriving in the first cycle rather than the third year.
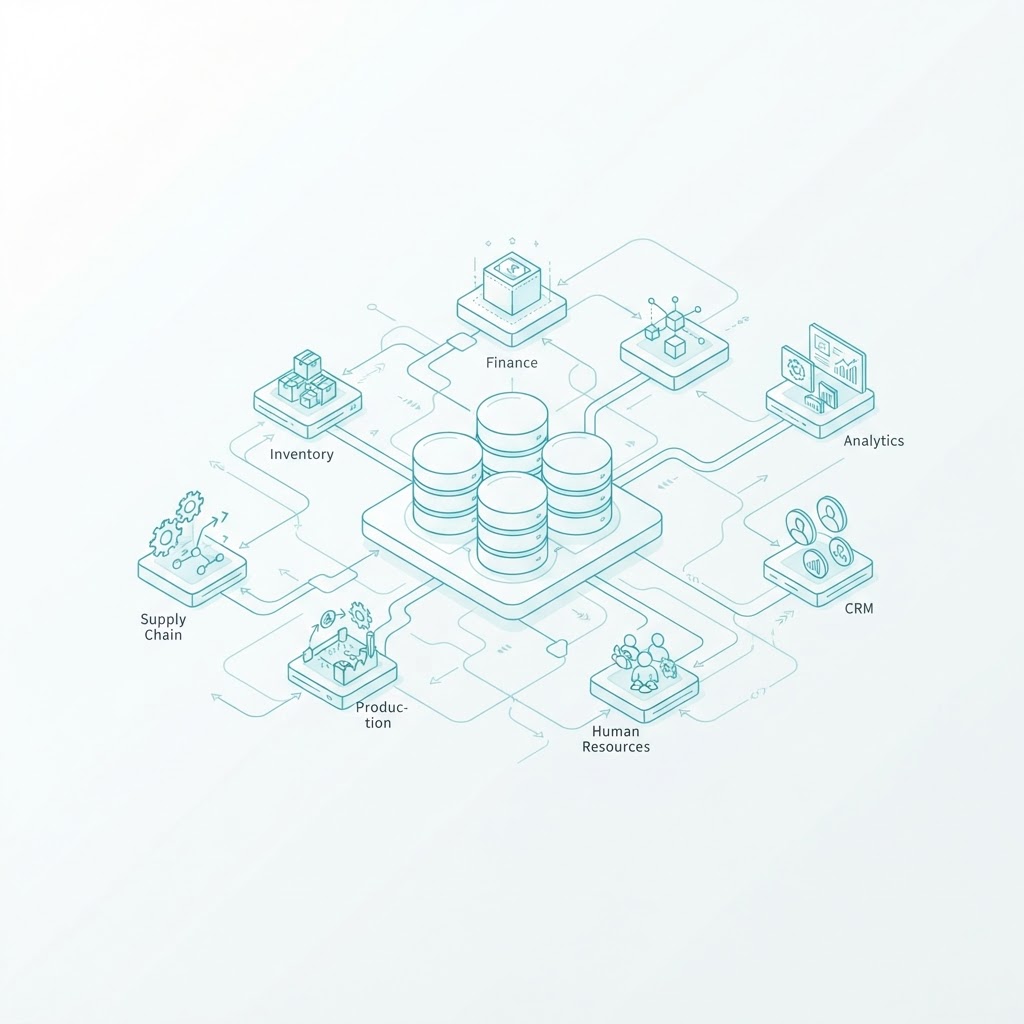
Where Should Your Operational Improvement Start?
... with the Process, Not the Platform.
Lean Six Sigma process improvement and Microsoft Dynamics 365 / Business Central delivery are two families of work, scoped and priced separately. You can commission the operation alone, the platform alone, or both in sequence — nothing on this page requires you to buy software. Where the gap is skill rather than system, our training and BAU support build the capability in-house.
Not shopping for a platform? · Our Approach
We design the TO-BE first. The AS-IS follows iteratively.
The classical order documents the AS-IS for months before anyone agrees what better looks like. We invert it deliberately — a designed future state is the cleanest lens through which to read the current one. No ERP licence and no Six Sigma certification programme is required to start.
Design the future state against a few measurable objectives, not a statement of intent.
AI and analytics baseline those objectives immediately, so you see the dynamism and not a snapshot.
Then revisit the current state, iteratively, and close the gaps in agile cycles.
The improvement is built into the workflow itself, so the operation cannot drift back to the old way.
Most strategies state a destination rather than an objective: best in class, top three, a leader. None of that can be measured, so none of it can be managed, and the dynamism of the business — its moving parts in time — never enters the conversation. We begin with a handful of objectives that can be tested, and with data rather than Excel bar charts, averages and percentages that hide variation, sequence and the tail.Why averages are not evidence
Processes that enforce themselves. Most of the market draws a picture of the process, has it signed off, and assumes people will go and read it. Nobody does: a document changes no behaviour, the old habit continues, and the money spent on the redesign is wasted. So we design the improvement into the workflow itself — in Dynamics 365 or Business Central the step, the approval, the exception route and the data capture sit in one place, so the operation runs the new process instead of being asked to remember it, and records its own data while the work happens. Incident response, staff rostering, a production line: the same principle. That is what makes the gain hold, and what puts excellence at the lowest implementation cost with the return in the first cycle rather than the third year.
Financial Operations (FinOps)
Complete financial operations coverage from source to close — automated invoicing, AP/AR management, AI-assisted 3-way purchase order matching, bank reconciliation, and full fixed asset management. Every financial touchpoint connected, controlled, and auditable, with predictive close analytics flagging exceptions before they hit the ledger.
Supply Chain & Inventory
Data-driven supply chain management with advanced analytics and machine-learning demand forecasting to optimise stock levels in real time. We apply Just-In-Time (JIT) inventory principles — reducing excess stock, shrinking physical warehouse footprint, and directly cutting brick-and-mortar operational costs.
Advanced analytics-driven JIT inventory reduces excess stock, shrinks physical warehouse footprint, and directly cuts brick-and-mortar operational costs — a compounding financial benefit that pays back your ERP investment faster.
Advanced analytics and AI are embedded in every capability — forecasting demand, detecting anomalies, ranking root causes and automating exceptions across finance and supply chain. Intelligence in the process, not a dashboard at the end of it.
Prediction, Detection & Automation
AI & Advanced Analytics
Forecasting, anomaly detection and AI-assisted exception handling built into the processes we design — grounded in the same measured baseline that proves the gain. Copilot and AI Builder are configured where they change a number, never as a demonstration.
Enterprise ERP — Fit-for-Purpose
Microsoft Dynamics 365
D365 Finance & Operations, Supply Chain, Sales, and Customer Service — every module configured to your actual operational dynamics, not a vendor template. High assurance of fit guaranteed by our LSS pre-implementation methodology.
SME & Mid-Market ERP
Microsoft Business Central
Business Central implemented with the same rigorous pre-implementation analysis. Right-sized for your business, designed around how you actually operate — not how a template assumes you do.
Inventory Intelligence & Cost Reduction
Advanced Analytics & JIT
Embedded analytics models predict demand patterns with precision, enabling Just-In-Time replenishment. The result: lower stock-holding costs, reduced physical storage space requirements, and measurable reductions in operational overhead.
Pre-Implementation Process Design
Value Stream Analysis
Every value stream mapped, measured, and redesigned before ERP configuration begins. We quantify waste and variation with statistical rigour so your ERP amplifies excellence — not inefficiency.
Operational Excellence Consulting
Lean Six Sigma Programmes
DMAIC-driven continuous improvement, Kaizen events, and statistical process control embedded into your operational culture — standalone or fully integrated with your D365 / BC environment.
Adoption & Governance
Change Management
Structured change management co-designed with process redesign from day one. People, processes, and platform aligned before go-live — never bolted on after.

Data-Verified Outcomes. Not Estimates.
Because we before implementation, every improvement is quantified against a verified starting point — and every control point is monitored by analytics that predict drift before it becomes a loss. This is what data-driven looks like.
Demand Forecast Accuracy
AI Forecasting
71%
94%
Exception Resolution
AI + Power Automate
6.4 hrs
0.4 hrs
Lead-to-Cash Cycle
D365 Sales
47 days
27 days
Financial Close
D365 Finance
15 days
5 days
Order Fulfilment
D365 Supply Chain
12.3 hrs
4.1 hrs
Customer Issue Resolution
D365 Customer Service
8.2 hrs
1.4 hrs
Month-End Reconciliation
Business Central
5 days
1 day
Inventory Accuracy
Business Central
91.2%
99.7%
No Platform Required: Classical vs AI-Augmented Lean Six Sigma
Where no ERP is being replaced, or none is needed yet, the method still decides the outcome. Measurement frequency and analytics change what a DMAIC programme can see, and how quickly it acts.
Data Capture Frequency
Periodic, batch sampling (weekly or monthly)
Continuous, real-time telemetry
Root Cause Analysis
Retrospective brainstorming and fishbone diagrams
Pattern analysis and predictive machine learning
Process Control
Reactive control charts, after defects occur
Predictive monitoring and self-enforcing alerts
Average Payback Period
9 to 18 months
3 to 6 months
Typical First-Year ROI
100% to 250%
300% to 600%+
Same DMAIC discipline in both columns. What changes is how often the process is measured, and how fast a drift is seen and acted on.
70+
Projects & Implementations
Over 25+ years of delivery.
300% to 600%
ROI In 12–18 Months
Typical return on AI-augmented Lean Six Sigma initiatives.
18
Industry Verticals
<3.4
DPMO Target (6σ)
Why These Numbers Hold
Guaranteed by Design, not by Promise.
A before and after figure is only worth reading if you can see why it could not have come out any other way. Three things make ours hold, and all three happen before a single improvement is claimed.
TO-BE Design First
The future state is designed against a few measurable objectives before we document the present. The target exists as a testable number, not a destination in a strategy paper-deck.
Measured, Not Assumed Baseline
Every figure above is a delta against your own starting point — capability, cycle time, defect rate — not an industry benchmark, and not an average of averages.
Self-Enforced Evidence-Based Gain
The redesigned step, the approval and the exception route live inside the workflow, recording their own data as work happens. Nobody has to remember the new process for it to persist.
Where The Risk Sits
With the Method. Not with You.
The baseline and the target are agreed in writing before configuration begins, so the first cycle tells you whether the gain is real. No platform licence, no certification programme and no third-year promise stands between you and that answer.
... measure improvement — not assume it.
Selected top-tier clients across government, transport, education, health, manufacturing and services — every programme baselined before it began.


All trademarks, logos and brand names shown are the property of their respective owners. Their use does not imply endorsement, affiliation or sponsorship of Go2Cab by the respective trademark owners.